             chemistry economics literature medicine peace physics
female_count         8         3         17       13    19       5
male_count 186 90 103 214 92 220Gender Across Nobel Prize Categories
Powell Sheagren
2023-11-27
Table of contents
- Introducing the question
- Data collection
- Data cleaning
- Data Analysis
- Conclusions
Introduction to the Question
What is the Gender Distribution of Nobel Prizes?
I would like to approach the question of what is the gender distribution over all the categories of Nobel prizes, are women more represented in some categories over others, and has representation changed over time overall and by category.
These are the categories in question:
Chemistry, Economics, Literature, Medicine, Peace, and Physics
Data Collection
Data of Gender, Year, Cateogory of Awards
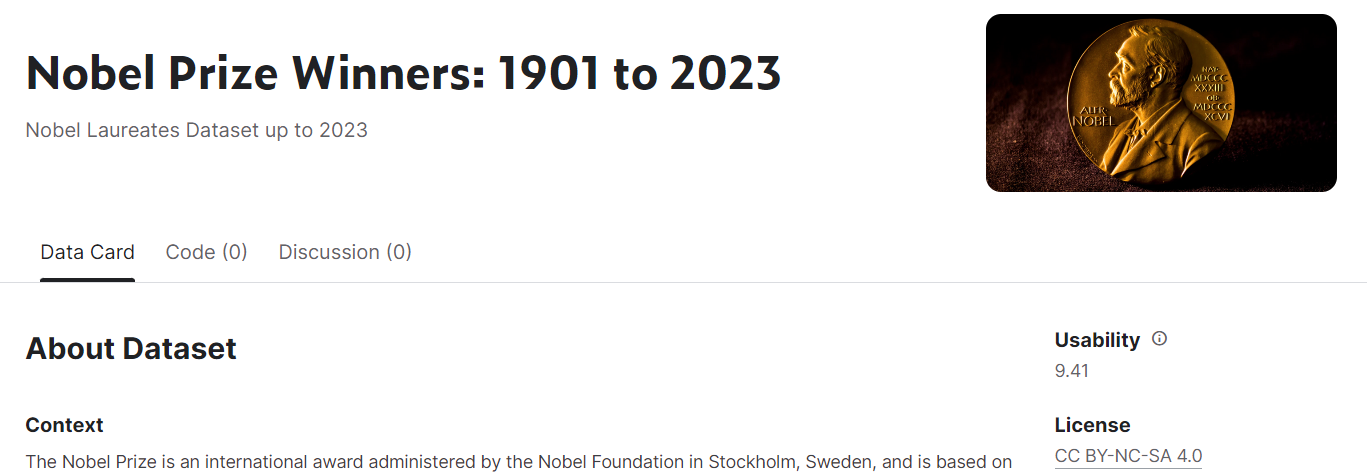
I found a dataset on kaggle with this information per recipients from 1901 to 2023. Other variables are included such as how many participants received each award, the age of the participant, where they were from, and a description of why they received the award.
Data Cleaning
Lower Stakes Data Cleaning
Most of the data was already processed, the cleaning steps mostly consisted of turning gender into a binary numeric value, removing organizations that had received awards, and formatting birth year to be consistent.
It is also convenient that the data is already independent due to years not having an effect on each other and categories being very different.
Data Analysis
Data Analysis Overview
- Summary Statistics/Fun facts
- Chi Squared test across category
- Regression over year
- Bootstrapping means
- Anova model for proof of difference
- Bootstrap mean rankings
Summary Statistics/Fun Facts
- 64 women and roughly 900 men have received Nobel prizes.
- Women received the largest share of awards in 2023.
- The most common country of origin is the United States with 29 percent.
- The most common city of origin was New York with 6 percent.
- Recipients were on average 60 years old with the oldest to receive an award being John Goodenough at 97 with a Nobel Chemistry Award.
- The youngest recipient at 17 is Malala Yousafzai who received a Nobel Peace Prize.
- Physics awards have been given the most out of all the categories.
- Economic awards have been given out the least.
Chi Squared test Across category
First let’s consider the question of whether or not the gender distributions of all the different categories are independent.
The data is formatted and a chi squared test of independence will be conducted with a null hypothesis that the data is all from the same distribution and an alternative hypothesis that they aren’t:
    Pearson's Chi-squared test

data:  count_table
X-squared = 41.382, df = 5, p-value = 7.855e-08
With a p value lower than .5 we can reject the null hypothesis and say there is a difference in the gender ratios across each category. This is a precursor to delving more into the differences in the categories and over years.
Regression over year
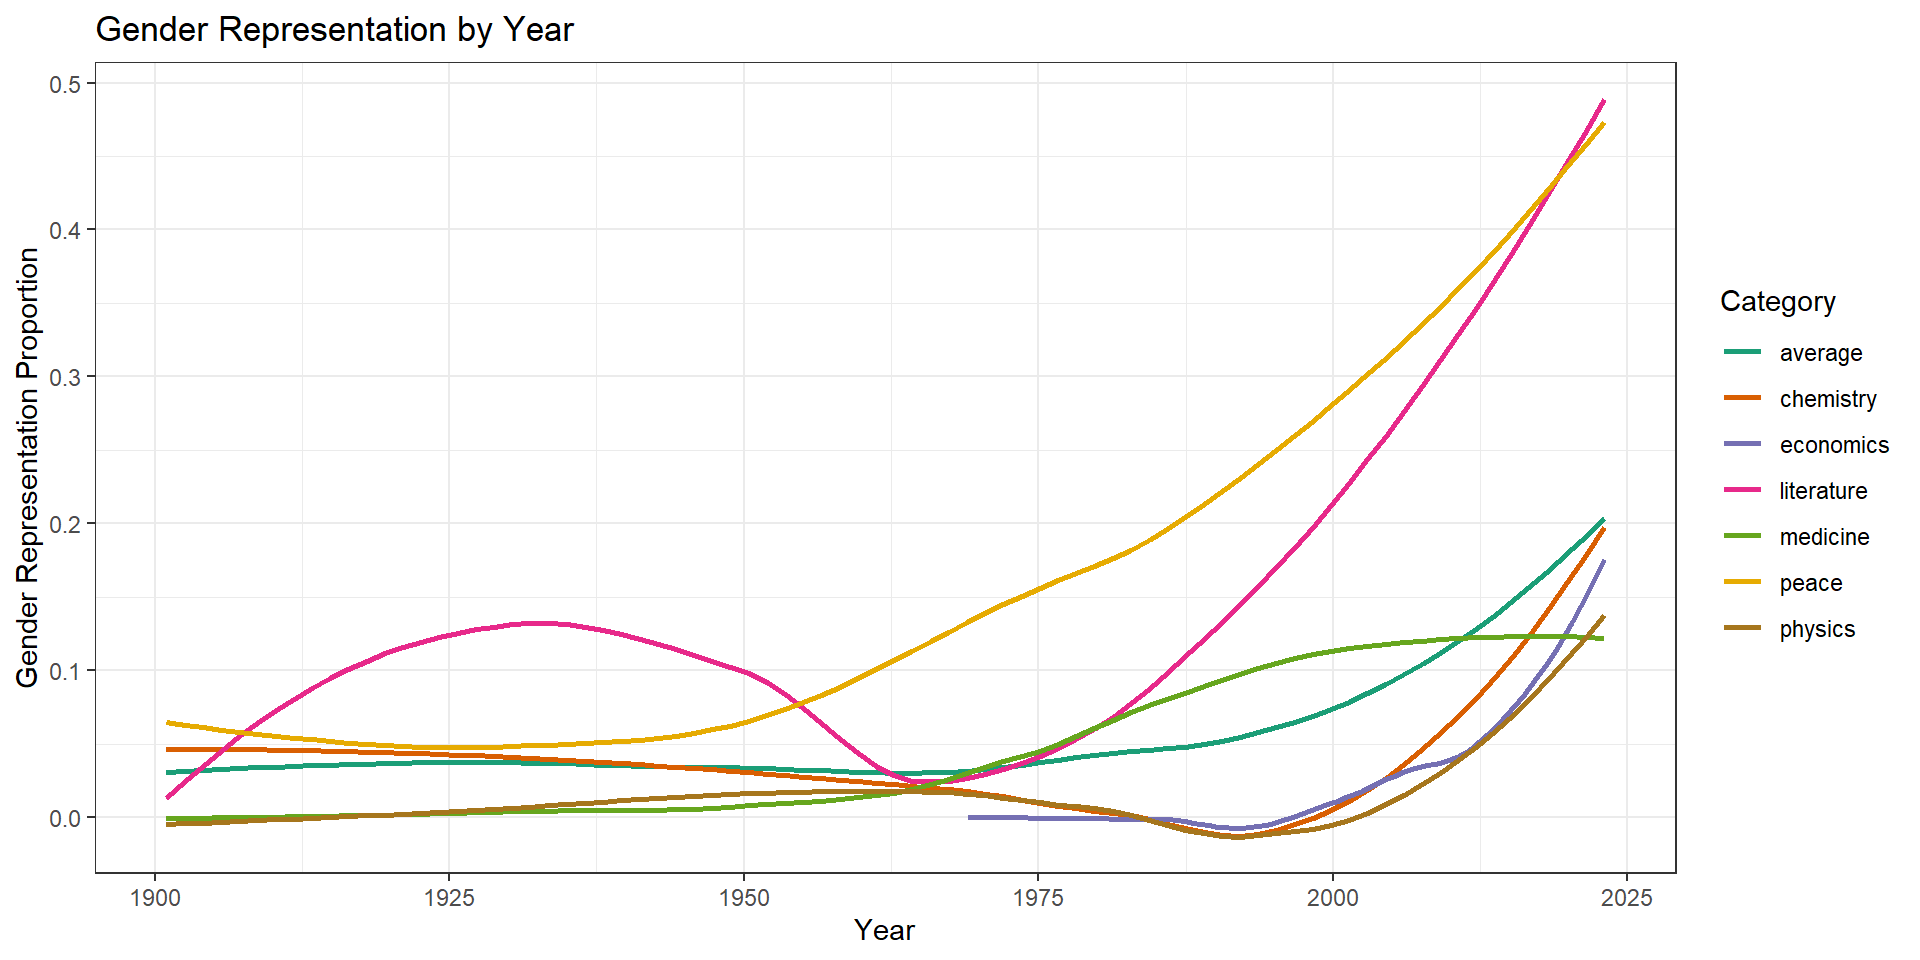
Regression over Year
Call:
lm(formula = gender_binary ~ year + category + year * category,
    data = nobel_data)

Residuals:
     Min       1Q   Median       3Q      Max
-0.34478 -0.06924 -0.03824 -0.01350  1.00609

Coefficients:
                          Estimate Std. Error t value Pr(>|t|)
(Intercept)             -8.062e-01  9.801e-01  -0.823  0.41096
year                     4.294e-04  4.962e-04   0.865  0.38701
categoryeconomics       -3.867e+00  3.263e+00  -1.185  0.23628
categoryliterature      -3.261e+00  1.545e+00  -2.110  0.03512 *
categorymedicine        -1.803e+00  1.377e+00  -1.309  0.19076
categorypeace           -4.913e+00  1.535e+00  -3.201  0.00141 **
categoryphysics         -1.334e-01  1.344e+00  -0.099  0.92093
year:categoryeconomics   1.925e-03  1.634e-03   1.178  0.23917
year:categoryliterature  1.715e-03  7.852e-04   2.184  0.02923 *
year:categorymedicine    9.228e-04  6.978e-04   1.322  0.18633
year:categorypeace       2.569e-03  7.794e-04   3.297  0.00101 **
year:categoryphysics     5.564e-05  6.806e-04   0.082  0.93486
---
Signif. codes:  0 '***' 0.001 '**' 0.01 '*' 0.05 '.' 0.1 ' ' 1

Residual standard error: 0.2387 on 953 degrees of freedom
Multiple R-squared:  0.09132,   Adjusted R-squared:  0.08084
F-statistic: 8.707 on 11 and 953 DF,  p-value: 7.761e-15
Despite the rise in representation recently, there only seems to be a statistical increase by category/year for the peace and literature prizes, these two sweep up more recently in the graph. The category values are all in comparison to the chemistry category.
Bootstrapping category means
### creating bootstraps

# initializing vectors
chem_boot <- c()
econ_boot <- c()
lite_boot <- c()
medi_boot <- c()
peac_boot <- c()
phys_boot <- c()

chem_data <- nobel_data %>% filter(category == "chemistry") %>% select(gender_binary)
econ_data <- nobel_data %>% filter(category == "economics") %>% select(gender_binary)
lite_data <- nobel_data %>% filter(category == "literature") %>% select(gender_binary)
medi_data <- nobel_data %>% filter(category == "medicine") %>% select(gender_binary)
peac_data <- nobel_data %>% filter(category == "peace") %>% select(gender_binary)
phys_data <- nobel_data %>% filter(category == "physics") %>% select(gender_binary)

sample_take_mean_return <- function(data,n){
  data_sample <- sample(data[,1],size = n, replace = TRUE)
  mean_sample <- mean(data_sample)
  return(mean_sample)
}

n <- 40


for(i in 1:10000){
  n <- 40
  chem_boot <- c(chem_boot,sample_take_mean_return(chem_data,n))
  econ_boot <- c(econ_boot,sample_take_mean_return(econ_data,n))
  lite_boot <- c(lite_boot,sample_take_mean_return(lite_data,n))
  medi_boot <- c(medi_boot,sample_take_mean_return(medi_data,n))
  peac_boot <- c(peac_boot,sample_take_mean_return(peac_data,n))
  phys_boot <- c(phys_boot,sample_take_mean_return(phys_data,n))

}


chem_boot_df <- chem_boot %>% data.frame()
chem_boot_df$category <- "Chemistry"

econ_boot_df <- econ_boot %>% data.frame()
econ_boot_df$category <- "Economics"

lite_boot_df <- lite_boot %>% data.frame()
lite_boot_df$category <- "Literature"

medi_boot_df <- medi_boot %>% data.frame()
medi_boot_df$category <- "Medicine"

peac_boot_df <- peac_boot %>% data.frame()
peac_boot_df$category <- "Peace"

phys_boot_df <- phys_boot %>% data.frame()
phys_boot_df$category <- "Physics"

boot_df <- rbind(chem_boot_df,econ_boot_df,lite_boot_df,medi_boot_df,peac_boot_df,phys_boot_df)
colnames(boot_df)[1] <- "gender_dist"
For each category I’m bootstrapping the means and then recombining them for analysis
Distribution of Bootstrapped data
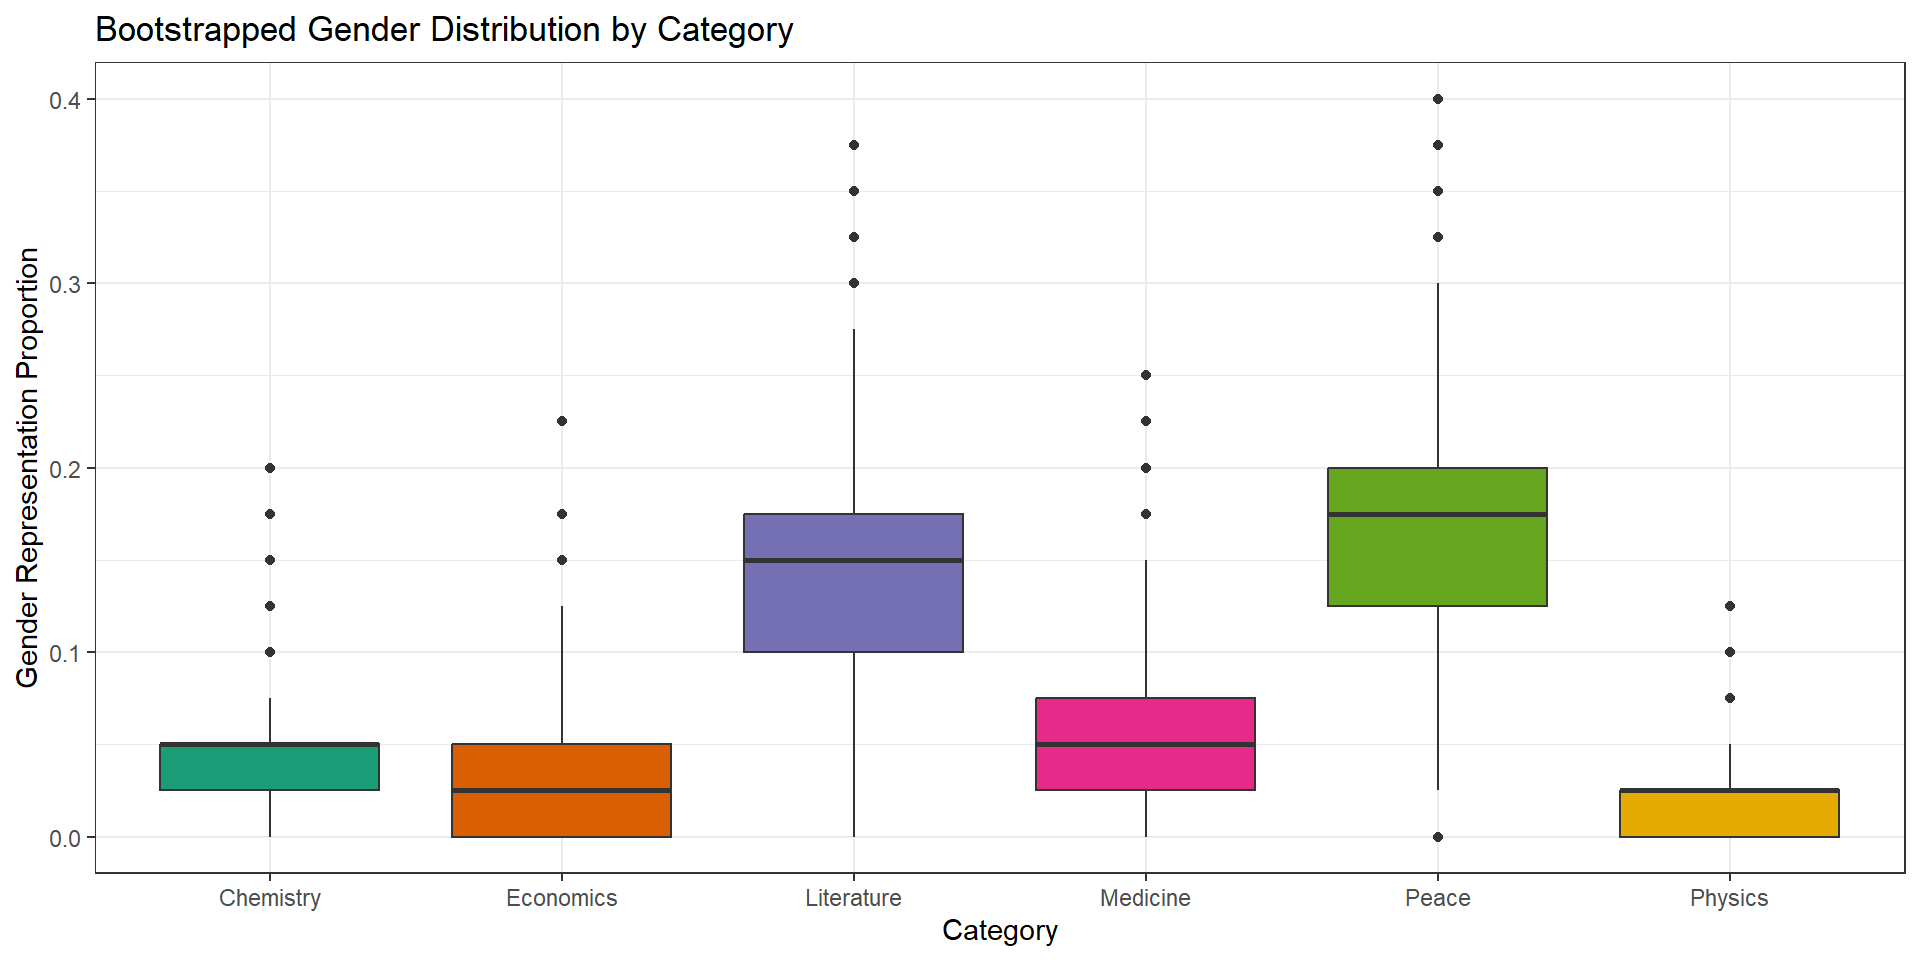
ANOVA of bootstrapped data
               Df Sum Sq Mean Sq F value Pr(>F)
category        5  202.2   40.44   23972 <2e-16 ***
Residuals   59994  101.2    0.00
---
Signif. codes:  0 '***' 0.001 '**' 0.01 '*' 0.05 '.' 0.1 ' ' 1
This test is to verify that the difference in the variables established by the chi squared test still holds after there has been a bootstrapping of the means. ANOVA tests use f scores and require normality of data which has already been established by the central limit theorem via bootstrapping.
Bootstrap Mean Ranking of Categories
While it is clearly established that there are differences amongst patterns, I wanted to find out statistically has the most and/or least gender representation. Based off of the bootstrap means here is the list from most to least women recipients:
6. Literature (17%)
5. Peace (14%)
4. Medicine (5.7%)
3. Chemistry (4%)
2. Economics (3%)
1. Physics (1.8%)
So physics is bringing up the bottom of the categories with women being roughly 10 times more likely to have received a literature Nobel prize. Honorable mention to the Peace category as well.
Conclusions
Conclusion
From the analysis we can see that there are differences in the gender representation across categories. Additionally, despite 2023 being the year with the largest percentage of women recipients, it does not seem that there are statistical increases in the gender ratio over time outside of a few categories.
The amount of women recipients did not change much on average for many years, with a slight dip in the 80s being an exception, and we may now be seeing more women who are finishing their careers receive recognition. Nobel recipients tend to be older so having more established women in these fields may be advancing the gender ratio.
While this is the current state of the Nobel prizes, there is reason to believe that the ratio of women recipients will increase across all categories in the future. Only more time will tell so I’ll check back in with everybody 20 years from now.
Thank You!
Any questions or comments
 Former Nobel Prize winning Women
References
Data:
https://www.kaggle.com/datasets/sazidthe1/nobel-prize-data
Photos:
Nobel Prize Winning Women:
https://cdn.vox-cdn.com/thumbor/S0SpFTqgSouoKm2mSV40Rq4xSv4=/0x0:2000x884/1200x675/filters:focal(840x282:1160x602)/cdn.vox-cdn.com/uploads/chorus_image/image/65863291/nobelnowomen1_lede2.0.jpg
Nobel Prize image:
https://upload.wikimedia.org/wikipedia/en/e/ed/Nobel_Prize.png